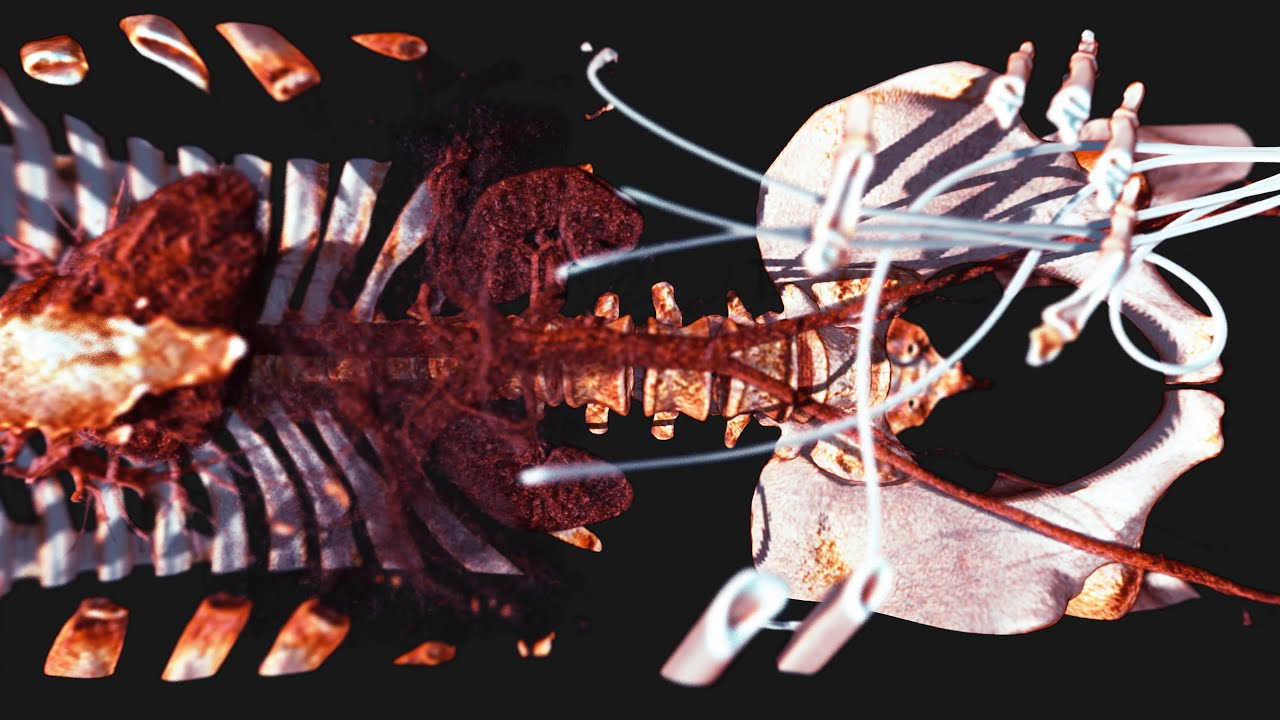
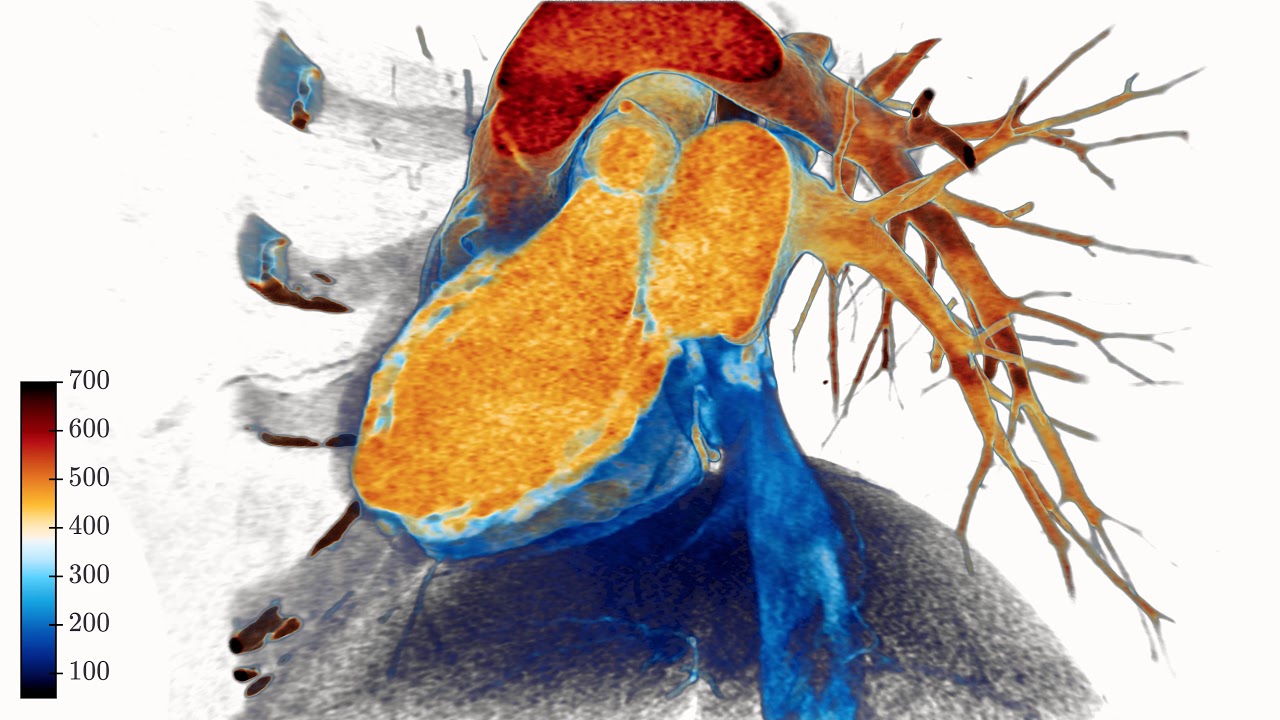
Overview#
K3D-jupyter is a Jupyter Notebook 3D visualization package.
The primary aim of K3D-jupyter is to be an easy 3D visualization tool, designed with native interoperation with existing powerful libraries such as PyVista, without being strictly dependent on them.
K3D-jupyter plots ipywidgets assuring a perfect interaction of a browser-side widget with Python kernel by a proven and standardized protocol.
Brief Examples#
import k3d
import numpy as np
from k3d import matplotlib_color_maps

data = np.load('streamlines_data.npz')
plot = k3d.plot()
plot += k3d.line(data['lines'], width=0.00007, color_range=[0, 0.5], shader='mesh',
                 attribute=data['v'], color_map=matplotlib_color_maps.Inferno)

plot += k3d.mesh(data['vertices'], data['indices'],
                 opacity=0.25, wireframe=True, color=0x0002)
plot.display()
K3D panel
Controls
Full screen
cameraAutoFit
gridAutoFit
gridVisible
fpsMeter
Mode
Camera
Manipulate mode
FOV
voxelColor
lighting
time
fps
Clipping planes
Objects
Line #1
colorLegend
vmin
vmax
opacity
radialSeg
shader
visible
width
Mesh #1
color
flat_shading
opacity
visible
wireframe
Info
Js version:
Advanced Examples#


Offscreen rendering#
Click to open YouTube video.